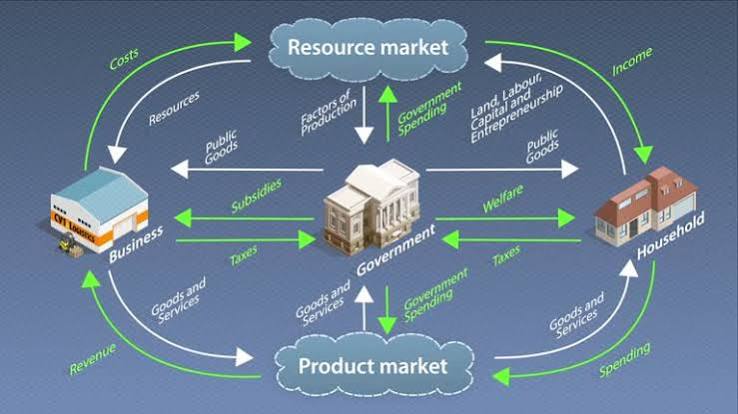
A colorful diagram links a warehouse, a house, a government building and two cloud-shaped markets with white and green arrows. It is the circular flow model, one of the most useful pictures in economics, and it explains where money, goods and jobs come from and where they go.
What the image shows
The diagram has five actors:
- Business (a warehouse) at the left
- Household (a house) at the right
- Government (a columned building) at the center
- Resource market (a cloud) at the top
- Product market (a cloud) at the bottom
White arrows show real flows, such as resources, goods and services, and public goods. Green arrows show money flows, such as income, spending, taxes, subsidies, welfare and revenue. Together they form loops that keep the economy running.
The two markets
The resource market (top) is where the inputs of production are exchanged. The diagram lists them as land, labour, capital and entrepreneurship. Households supply these, for example by working or renting out property, and businesses buy them. In return, households receive income, which is the green arrow running down the right side. For businesses, the same payments are costs. frontaranews
The product market (bottom) is where finished goods and services are sold. Businesses supply them, and households buy them. Households’ spending becomes the businesses’ revenue, completing the loop.
The basic circle
Read the diagram clockwise and the logic is simple:
- Households provide labour and other resources to businesses.
- Businesses pay income to households for those resources.
- Households spend that income on goods and services.
- Businesses earn revenue, which they use to pay for more resources.
Each part depends on the others. If households spend less, business revenue falls, firms may cut jobs, and household income drops, which reduces spending further. That chain explains how slowdowns can feed on themselves.
The government in the middle
The diagram’s government sits at the center and connects to everything else:
- Taxes flow from both households and businesses to the government.
- Welfare flows from the government to households, through payments and support programs.
- Subsidies flow to businesses, for example to support particular industries or keep prices down.
- Government spending flows into both markets, as the government buys resources (such as hiring workers) and purchases goods and services.
- Public goods such as roads, schools, policing and defense are provided to both businesses and households.
In other words, the government collects money from the circle and puts it back in, reshaping who gets what.
Leakages and injections
Economists often describe the model in terms of what leaves and enters the loop:
- Leakages take money out of the cycle: taxes, savings and spending on imports.
- Injections add money to the cycle: government spending, business investment and export earnings.
When injections exceed leakages, the economy tends to expand. When leakages are larger, activity can slow. This is a simplified idea, but it helps explain why policymakers adjust taxes, spending and interest rates to steady the economy. This simple diagram leaves out banks and foreign trade, which add savings, borrowing, imports and exports to the picture in fuller versions of the model.
Why this matters in real life
The circular flow turns many news headlines into plain cause and effect:
- A tax cut leaves households with more to spend, which can lift business revenue, although it also reduces government income.
- A subsidy cut raises costs for businesses and may push up prices for households.
- Higher government spending on infrastructure creates jobs and demand, but it must be funded by taxes or borrowing.
- Rising unemployment reduces household income, spending and tax receipts all at once.
- Inflation raises the prices households pay in the product market, so the same income buys less.
Where Bangladesh fits
The same loops operate in every economy, though the details differ. In Bangladesh, a large share of household income comes from work in garments, agriculture, services and remittances from abroad, so the flows with the rest of the world are especially important. Energy subsidies, social protection payments and public investment are the kinds of government flows the diagram highlights, and debates about how well they are targeted are a regular feature of national economic discussion.
Limits of the model
The circular flow is a teaching tool, not a full description of reality. It does not show:
- Banks, savings and investment in detail
- International trade and foreign investment
- The informal economy, which operates outside official records
- Environmental costs or the depletion of natural resources
- Differences in wealth and bargaining power among households and firms
Still, as a starting point for understanding how the pieces connect, it remains hard to beat.
The takeaway
The diagram’s message is that no part of the economy works alone. Households need businesses for jobs and products, businesses need households for labour and customers, and both rely on government for rules, services and support. Understanding the loop makes it easier to follow the news, from interest rate decisions to budget debates, and to see why a change in one place rarely stays there.
Copyright & Disclaimer
© 2026 Frontara News. All rights reserved. This article is original content written for frontaranews.com. No part may be reproduced, copied or redistributed without prior written permission, except for brief quotations with proper credit and a link back to the original article.